III. What is Good for a City?
Is that really what you want?
where does it go?
Hi folks,
Sorry for the delay (who knew it would be tough to get things done while locked in a house full of kids for three months). In our last couple of posts we took a look at where Winnipeg spends money, and how we compare to other cities.
Now I’d like to bring the focus down to the individual level and look at how Winnipeg spends your money. We’ll take a look at how much of your property taxes go to which city services. Then we can zoom back out to the original question we started the series with: What is good for our city? Given what you value—and setting aside possible inefficiencies, which we looked at last time—does where your money goes line up with what you think is best for the city?
2019 operating costs
On page 209 of the 2020 Community Trends and Performance Report (vol. 1), the city breaks down the % cost per service:
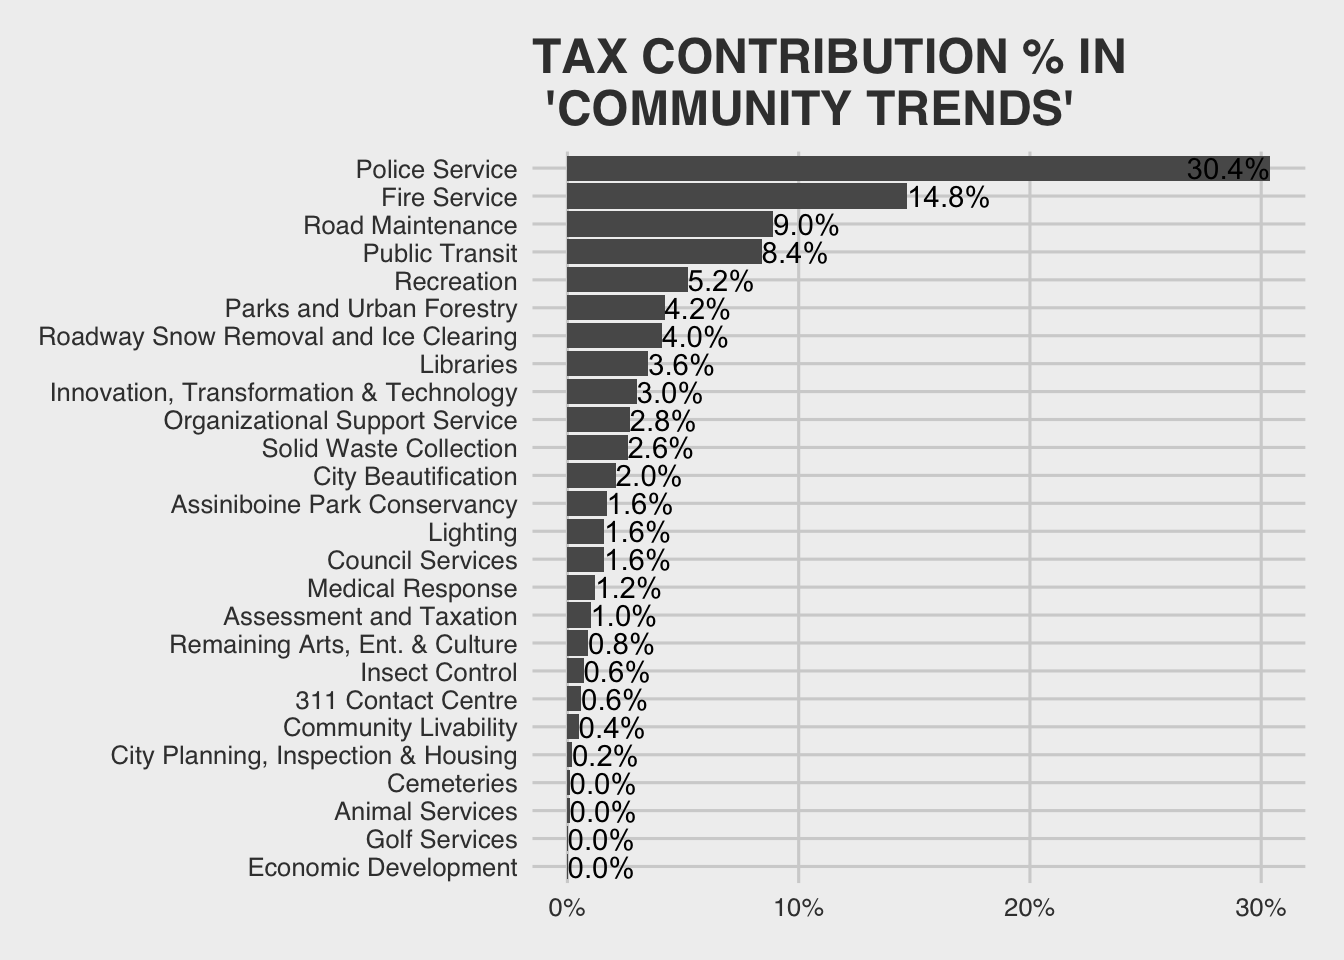
But, it looks like this breakdown does not include capital expenses (like building new roads and buildings) since it mirrors the 2018 operating expenses pretty closely. Plus, as we learned in a previous post, when we include capital expenses, Public Works/road expenditures is much larger than the proportion in the provided breakdown. That makes the picture provided by the City a bit misleading since, if we stopped here, we’d think that most of our property taxes go to the police, but that isn’t the case.
To help correct for capital expenses, let’s rescale the percentages and add a blanket “capital expenditures” category equal to the proportion in 2018—which will be a similar ratio in 2019. That gets us the following by % breakdown:1 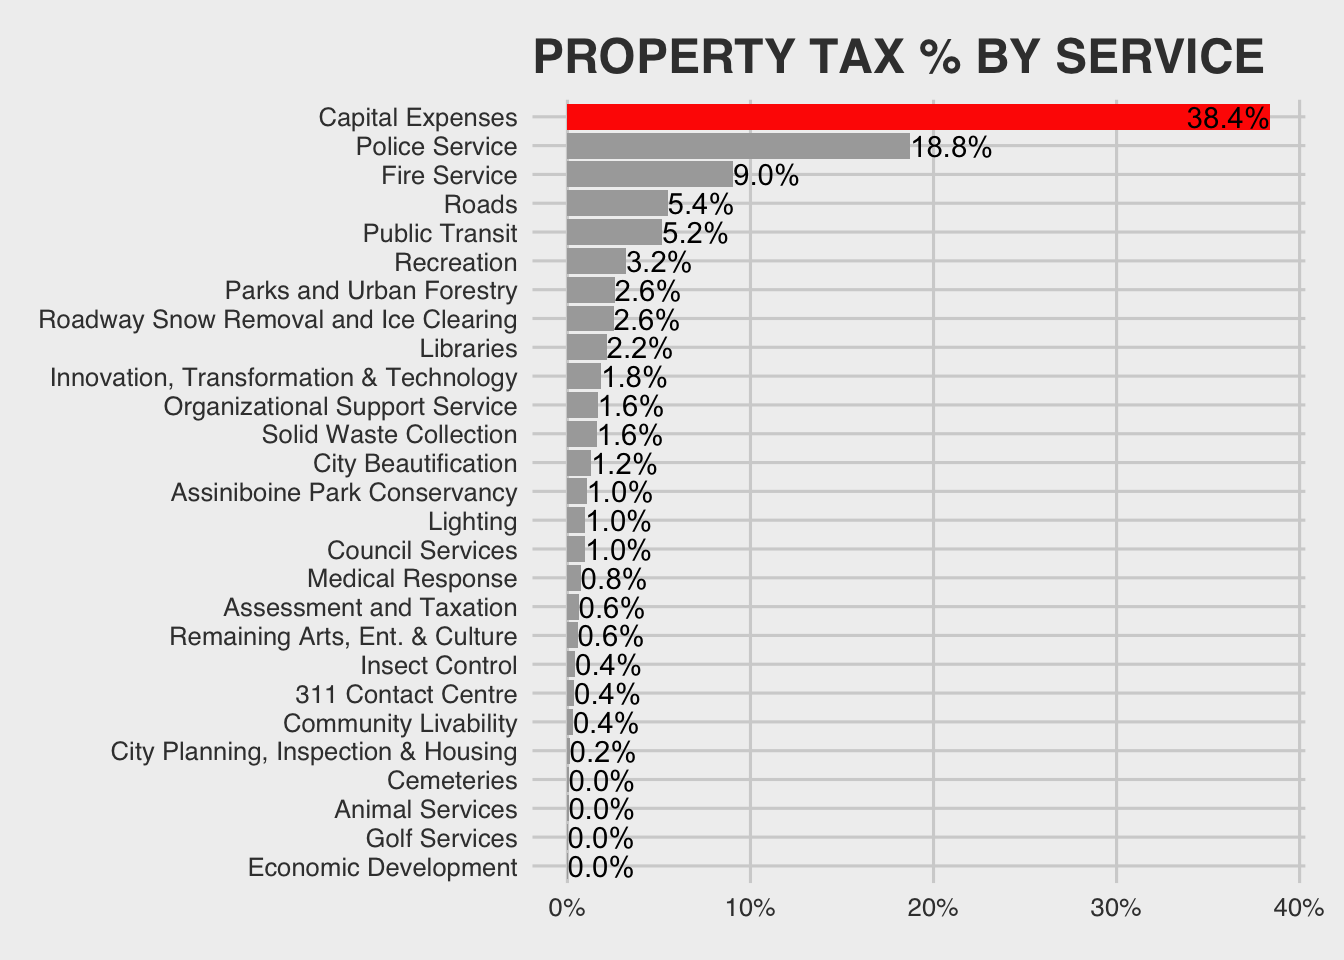
But, the capital expenses can be broken down too, for a more accurate picture of where our property taxes go. To do that, let’s pull down our significant capital expenses from the Winnipeg Open Data portal, and categorize them in roughly the same way that the City categorized them in the service breakdown.
Like most data exercises, this will involve some interpretive work—don’t let anyone fool you into thinking numbers eliminate subjectivity!—so I’ll try to highlight possible gotchas. (I also recommend looking over the provided mapping table below if you care!)
At a high-level, some choice points were putting active transportation / bike paths into “Recreation” instead of “Roads” when they aren’t in transportation corridors, and into “Roads” when they are. I also wasn’t sure where to place the new bus rapid transit (BRT) corridor. It’s a road, serving road-like purposes, but it’s for Transit riders, but if it works it will decrease congestion for other drivers, but… so I put it in it’s own category—do with it as you’d like.2
With all of that, here is the new breakdown: 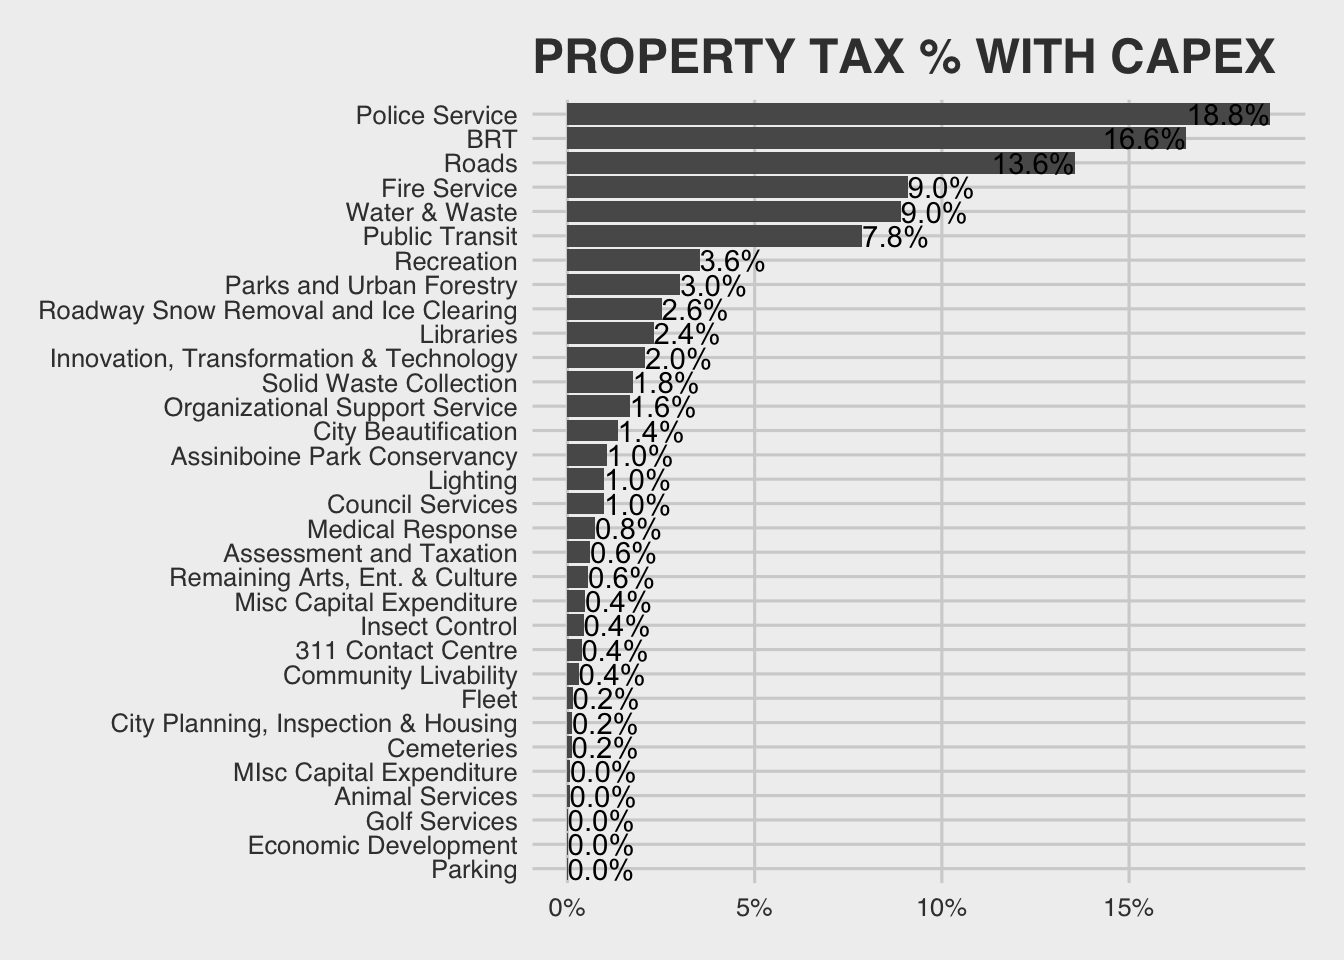
And, for those interested, here is the capex to service mapping:
To see what this means in terms of your property taxes (if you own a home in Winnipeg), let’s pull down property assessment values and frontages from the City’s open data portal. Then we’ll mash them up against our mill rate (the rate you pay on assessed property value in municipal taxes) and frontage levy to get your approximate property tax. From there we can break it down by service.
In the app below, select your home and you should be able to see what you pay yearly (in property tax) for each service:3
A couple of things here are worth noting. First we spent a ton on the south west BRT road in 2019. This has already been panned in a lot of places—here is a favorite from another blogger—and it is reoccurring issue:
Roads are expensive, they degrade quickly (and then are expensive to rebuild), investing in them often increases gridlock—thankfully unlikely in this case, and we can’t afford to repair even the ones we have…
Putting the magnitude of spends like these into context, with that $357 million you could run any one city service for an entire year—even the heavy hitters. In fact, you know those libraries they were talking about closing (before they were yelled down) in the 2020 budget: that’s absolutely nothing compared to this (big) road. All libraries together have a ~$30M yearly operating budget. You could keep all of our libraries operating for 10 years without any additional operating investment for the cost of the South West Rapid Transit road.
Prefer buses to reading, fine! With transit fare revenue under $87M a year,4 everyone could have free transit for over 4 years. Or, we could add some new bus lanes at the cost of paint and labour. Both of these have a residual benefit of getting people out of cars, which will speed up the average transit commute (isn’t that the point of rapid transit anyways)!
Given all that, I would probably prefer if we…stop blowing through money on expensive new roads! (Even ones for Transit.)
It is super interesting to see how much (or little) we have to commit to get some of the services we do. Would I pay $300 to live in a city with a water utility? Definitely. Would I be willing to pay $50 per year for City Beautification? Probably. $40 a year to support the Assiniboine Park Conservancy? Maybe, if enough people enjoy it. How about 50 cents for golf—you know, that service we’re considering selling off?… $620 for a bus road? Meh, not so much.
Does this budget allocation line up with what you think is best for the city?
All of the views expressed on this blog are my own opinions, all data is openly available, and all analyses coded using reproducible research methods posted publicly.
Using the same data from our previous posts via the Winnipeg Open Data portal.↩
Additionally, since the city seems to be including department-specific revenue streams in their cost breakdown by service, I have done the same in calculating the overall proportion of capital expenses to operating expenses. This isn’t perfect since it’s tough to see a clear principle for treating services that generate revenue differently from those that don’t, but that’s what we have to work with.↩
This works best for single detached homes. Condo’s are in the data too, if you wanted to trace it back, but the data is a lot messier in that case, so I just pick one unit in multi-unit dwellings.↩
Based on the 2019 operating budget↩
Thank You!
Your comment has been submitted. It will appear on this page shortly! OKYikes, Sorry!
Error occured. Couldn't submit your comment. Please try again. Thank You! OK