I. What is Good for a City?
Analysis prioritization: city costs & expenditures
square one
I have now been hired into two “green field” data science positions—roles that orgs spin up because they know they need to “leverage data” to avoid falling behind, but aren’t quite sure how they should make use of their data or what potential ends data science can be directed towards.
I’m not really interested in writing another post about whether or when orgs should invest in data science; there are lots of them out there. But, I think it is worth talking about what to do when starting with a blank slate in data analysis… especially since we’re kind of in that state with this blog!
a “good” start
A common, but unhelpful, first request in these types of roles is to quickly “generate value”.1 In private/for profit orgs, this is usually amounts to increasing profits (duh). Starting with this assumption, good “green-field” data science requires quickly figuring out which levers affect profitability, and then facilitates moving those levers—though discovering them is already great progress!
In my experience, a good way to start in this context is to perform exploratory data analysis on the financials and the factors that directly contribute to line items on the financials (we’ll do some of this for Winnipeg below). Looking at which line items are most predictive of profitability, but also how much controllable variance there is in those high-impact items. What is “controllable” variance? Unlike seasonal effects, which aren’t easily changed,2 often this is variance due to human actions & processes. It isn’t always easy to tease out, but modeling and hypothesis testing can help. High, initially non-explainable, variance can also sometimes point in this direction.
As a quick example, in retail orgs I’ve worked for, the financials revealed that variations in sales make a way bigger difference to profitability than variations in supply chain costs, or labor, or margins… So, it made sense to dig into what influenced sales first over factors for other areas of the org. (Of course, this might be different in other orgs, say if sales had very little controllable variability compared to some of those other things.)
good for a city?
Alright, so while this approach is a rough approximation at good “green-field” data science in the private sphere, what does that look like for a city? To go through the same exercise would require knowing what counts as “good for a city”… That’s not a super easy question to answer.3
I’m going to assume that there is some sense in which things can go better or worse for a city by furthering the interests of it’s inhabitants which overlap the most—things like: having clean drinking water, being able to efficiently get where they want to go, etc.4 So, a good “green-field” city analysis would round up the foundational things its inhabitants care about, and see where we (or people with real power) stand to make the most impactful change.
As it happens, there is a City of Winnipeg document that is meant to track this kind of thing, that takes input from community meetings and is agreed to by City departments and Council: Our Winnipeg. Unfortunately, it hasn’t been updated in a decade. Fortunately, it is slated to be updated in 2020, so public discussion like this could stand to influence the direction our city takes! (See, I told you we were interested in high impact analyses…)
At a high level, Our Winnipeg sets out these goals:
The “basics” matter: public safety, water quality, wastewater and transportation infrastructure, and public amenities and facilities are the essentials to keeping people healthy. But quality of life goes beyond the basics. Our communities need to support various lifestyles, providing a range of options for living, working and playing. A variety of housing styles for residents to choose from are required, as are transportation choices for residents and businesses alike. The whole system has to work together efficiently and sustainably. (Our Winnipeg, 2010, p. 2)
This list is a reasonable starting point… But, it’s not perfect for what we are trying to do here: it’s long, but more importantly it doesn’t tell us how to trade off the listed items. So, where to now? The easiest place to look for a high level overview is… you guessed it, the financials. How Winnipeg actually spends its money tells you how the City actually traded off the common goods listed in Our Winnipeg.5 Assuming they were effectively aiming at those lofty goals (a big assumption), it should give us an idea of where the biggest opportunities for optimization lie. Or, at very least, will allow us to ask whether we think that where we spend our money lines up with the things we value in a city.
some Exploratory Data Analysis
Let’s look at some data. The City of Winnipeg Open Data portal has info on operating budgets (up to 2018), and large capital expenditures (updated monthly, and with a minimum budget of 5 million). We don’t have actual total operating expenditures, which would be ideal and the actual capital expenditures are limited to “big” projects. But, the operating budget should roughly line up with the City’s actual operating expenditures, and as long as there aren’t too many small capital expenditures, we will get an approximate picture. Either way, we’ll take what we can get. (As an aside, operating expenses are the “keep the lights on and employees paid” type expenses. The capital expenses are funds spent on major projects like building bridges, libraries, road renewal, and bus rapid transit (BRT).)
Summarizing the open data, we get these top areas of operating expenditure and net operating cost:6 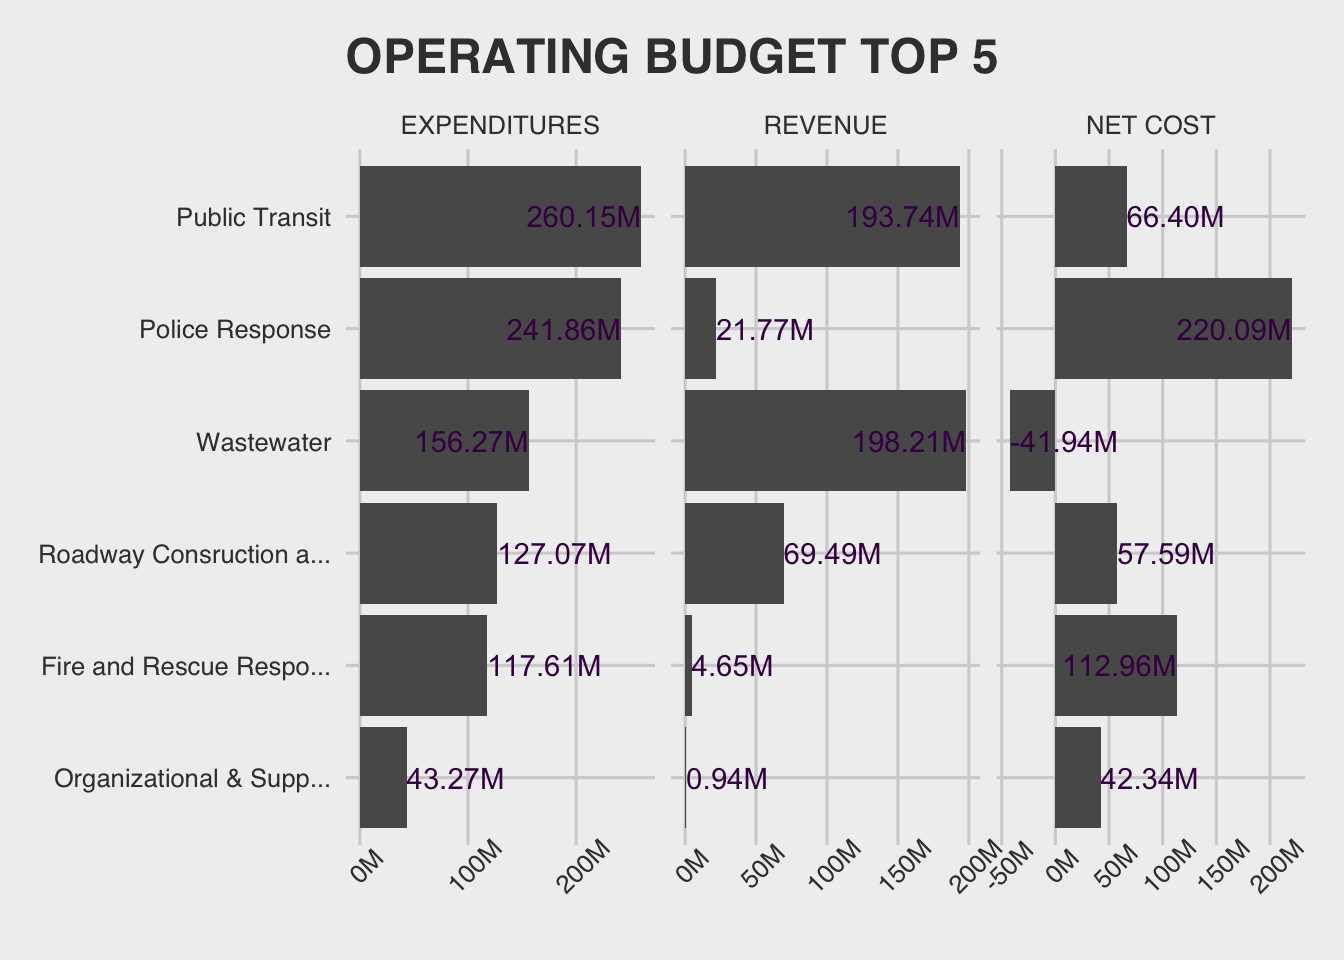
So far so good… the top 5 look pretty important to me. How about on the capital expenditures side: 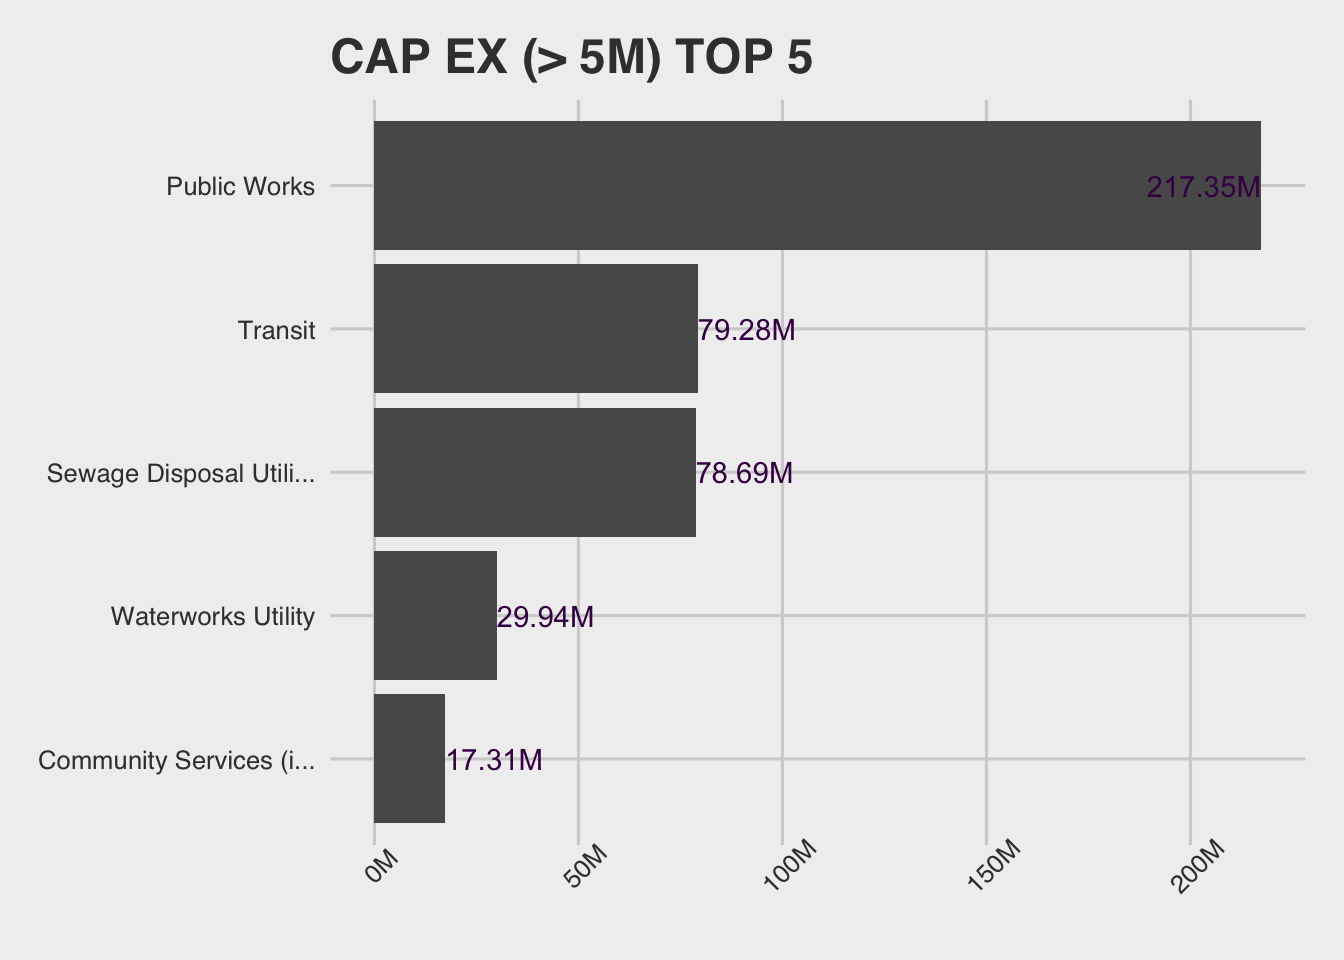
Putting both together we get: 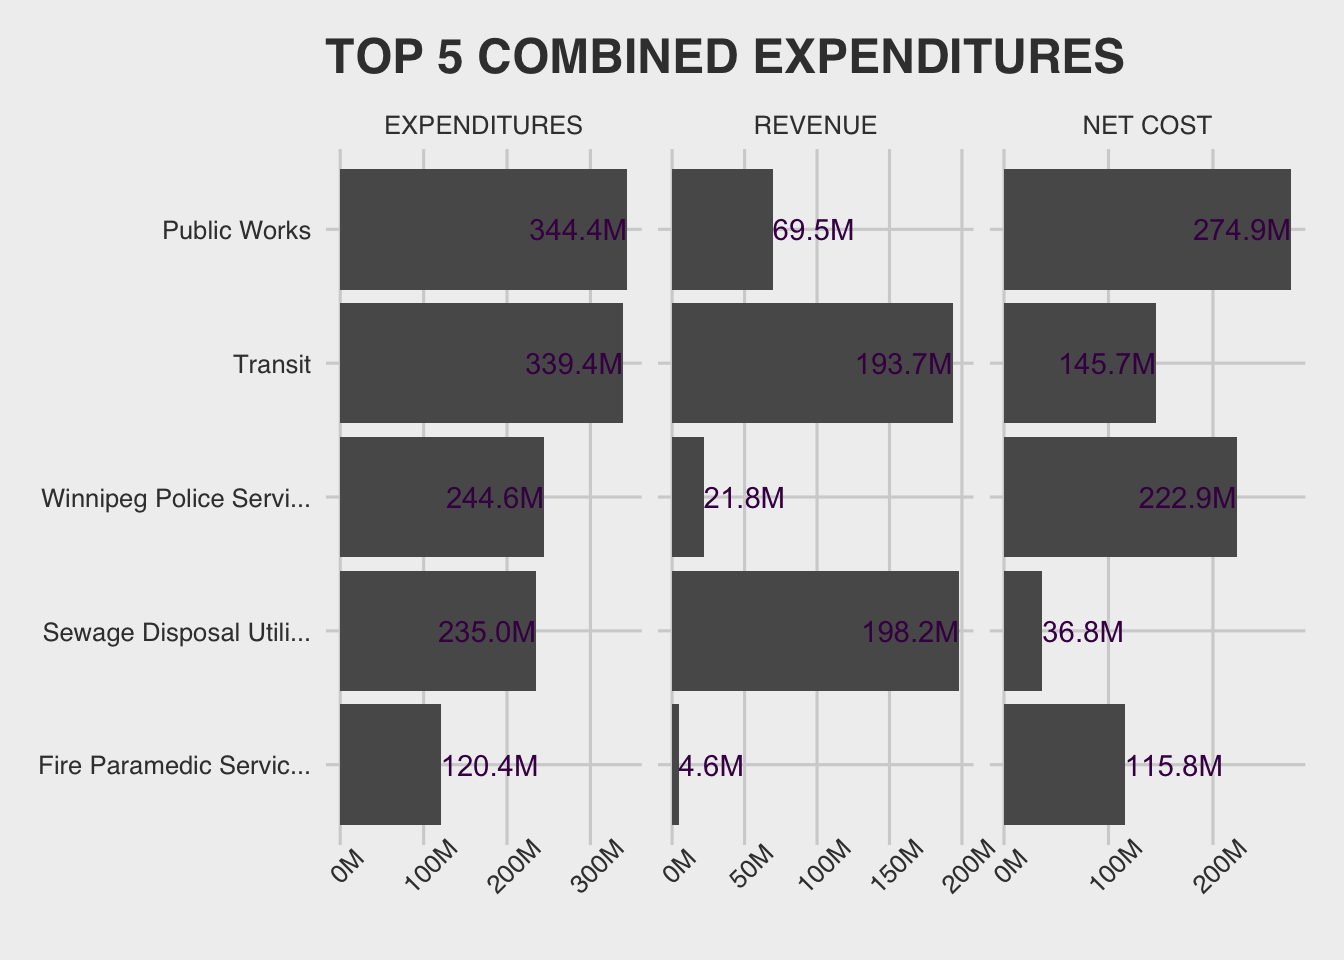
This gives us a pretty good idea of the main cost-centers for the City. Whether we want to look at department expenses alone or net, after revenue from those departments, the top three are:
- Public works (the department responsible for infrastructure like roads, bridges, etc.),
- Transit, and
- The Winnipeg Police Service.
Digging in to these three a bit further, on the operating side the expenditures break out as follows:
On the capex side, the heavy hitters were:
summing up
Alright, so we’ve laid out some first steps on the “green-field” analysis problem, working on the City of Winnipeg’s open data as a working example.
Using the City’s financials as a guide to where the value/highest return potential is by department, we summed up the main cost centers for the City of Winnipeg. Then we took a very superficial look at how those costs break down based on openly available data.
While the analysis is superficial, it does give a first idea of which departments could benefit the City most through optimization. In brief, we spend our money on roads & buses—or transportation—on the one hand, and pubic safety & emergency response represented by policing, fire and paramedic services on the other. Sewage disposal from Water and Waste gets honorable mention. Those are pretty core services, so nothing too surprising yet—though it was cool to see the breakdown using data from Winnipeg’s open data initiative.
Ideally, we would be able to see how this breaks out over months and years to get a sense of how they are trending and how much these items vary. With only one data point, and only a couple of yearly data points on the operations side in Winnipeg open data, this isn’t really an option here. It is also critical to search out influencible measures which are correlated with the bottom line measures, and assess how much influence we have over these “lead” measures.
Since we don’t have the luxury of self-comparison, next time we will do the next best thing: comparable-comparison. We will take a look at how our efficiency and effectiveness measurements in our most impactful departments stack up against those of comparable cities (again using open data). For me at least, this was a bit more surprising!
Talk soon.
All of the views expressed on this blog are my own opinions, all data is openly available, and all analyses coded using reproducible research methods posted publicly.
Ugh. I think I just vomited up some of the “low hanging fruit” I had earlier.↩
Though there are some cases where you can create seasonality through marketing efforts.↩
A first problem is that it is not clear whether there is any unified thing that counts as a city. Whatever it is, is it really the kind of thing that could do better or worse? What is good from my point of view, an inhabitant of the City, is often different than what is good from my neighbour’s point of view. Worse, it is even less clear whether there is one measure—like “profitability”, in the private case—that can be analyzed and optimized for as an analyst.↩
An interesting take on what is rational for a city that parallels this by Kenny Easwaran can be found behind a paywall here.↩
Trading non-locally fungibles is kind of what money is for, after all.↩
We will consider the revenue side of the equation in the next post.↩
First test comment using ‘staticman’ as a comment system (https://staticman.net/) Recommend as an open source (“free”) blog commenting resource.
It is a bit tricky to get set up using the Rmd > Hugo > Github > Netlify workflow, but its documentation along with your theme's documentation (https://minimo.netlify.app/docs/comments-support/) and the thread (https://github.com/eduardoboucas/staticman/issues/306) should get you started.